Power-spectrum estimation#
Building an estimator#
PowerSpectraBuilder constructs an estimator whose
geometry matches a Cartesian or spherical cube. Its configuration controls
the frequency transform, UV selection and binning, primary beam, weighting,
and optional exclusion of wedge or low-k_parallel modes:
import numpy as np

from ps_eor import pspec

config = pspec.PowerSpectraConfig(
    window_fct="blackmanharris",
    ft_method="lssa",
)
config.umin = 50
config.umax = 250
config.du = 10

ps_gen = pspec.PowerSpectraBuilder(config).get(cube)
kbins = np.logspace(np.log10(ps_gen.kmin), np.log10(0.5), 10)
The estimator can use the full frequency band, a named
EorBin, an explicit MHz range, or a band centred on a
redshift. The selected bandwidth determines the line-of-sight resolution and
cosmological normalization.
Important
The default primary_beam is "lofar_hba" and the beam enters the
power-spectrum normalization. Set the appropriate instrument beam for
non-LOFAR data, or use "no_pb" when a unit beam is intended.
Common configuration parameters#
Parameter |
What it controls |
Units or values |
Default |
|---|---|---|---|
|
Spectral window applied before the frequency-to-delay transform. |
Any window accepted by |
|
|
Frequency transform used to form the cylindrical spectrum. |
|
|
|
Whether to remove the frequency mean before the transform. |
Boolean |
|
|
Whether the cylindrical result retains only non-negative \(k_\parallel\). |
Boolean |
|
|
Baseline range included in the estimate. |
Wavelengths |
|
|
Width of transverse UV bins. |
Wavelengths |
|
|
Selects uniformly spaced UV-bin centres instead of the explicit
|
Boolean |
|
|
Whether |
Boolean |
|
|
Enables additional weighting derived from measured noise. |
Boolean |
|
|
Excludes lower \(|k_\parallel|\) modes during spherical averaging. |
\(\mathrm{h\,cMpc^{-1}}\) or |
|
|
Excludes modes below the foreground-wedge line during spherical averaging. |
Degrees |
|
|
Upper limit of automatically generated spherical k bins. |
\(\mathrm{h\,cMpc^{-1}}\) |
|
|
Number of logarithmic spherical k-bin edges. |
Integer |
|
|
Primary-beam model used in the power-spectrum normalization. |
Registered beam name |
|
These values can be stored in a
PowerSpectraConfig file or overridden for one estimator
through get(). The
Power-spectrum API lists the remaining settings.
Available products#
Request an individual product when that is all the analysis needs:
ps = ps_gen.get_ps(cube)
ps2d = ps_gen.get_ps2d(cube)
ps3d = ps_gen.get_ps3d(kbins, cube)
variance = ps_gen.get_variance(cube)
Use get_all to calculate all standard products together:
products = ps_gen.get_all(kbins, cube)

products.ps.plot()        # spatial P(k_perp) versus frequency
products.ps2d.plot()      # cylindrical P(k_perp, k_parallel)
products.ps3d.plot()      # spherical Delta^2(k)
products.variance.plot()  # variance versus frequency
get_all is a convenient shorthand when all four products are wanted;
calling the individual methods is also fast and is often clearer when only a
subset is needed.
Results are stored in Kelvin squared. Their get and plot methods can
present values in mK squared, or in mK for field amplitudes. Wavenumbers use
h cMpc^-1.
Compatible power-spectrum products also support addition, subtraction, and
scalar multiplication. For example, 0.5 * (ps_a + ps_b) averages two
products and ps_data - ps_noise forms a noise-debiased estimate. The
coordinates and product types must match; uncertainties and weights are
propagated by the result class.
A four-panel simulated example#
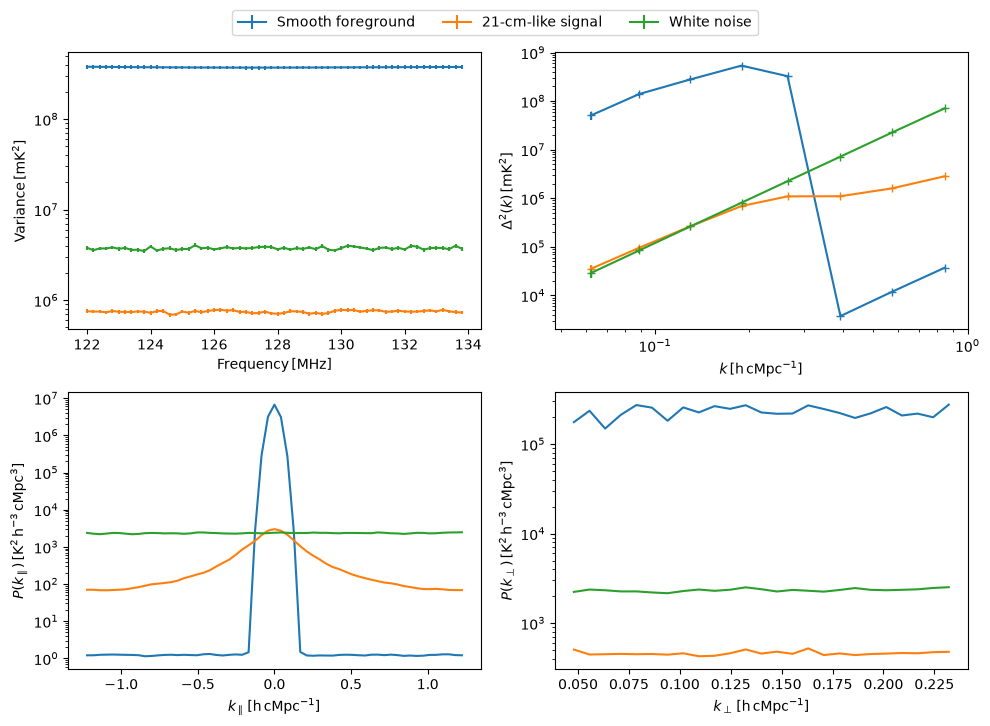
FourPanelPsResults compares several cubes in four
representations: variance versus frequency, spherical
\(\Delta^2(k)\), cylindrical power averaged over
\(k_\perp\), and cylindrical power averaged over
\(k_\parallel\).
The figure below is generated from three independent components drawn with
SimuMultiGPCube: a smooth foreground covariance, a
shorter-coherence 21-cm-like covariance, and white noise.
The complete figure-generation script is included in the documentation. It
uses the covariance-kernel simulator and therefore requires the ml-gpr
installation extra.
Show the figure-generation script
"""Generate the four-panel power-spectrum figure used in the user guide."""

from pathlib import Path

import matplotlib

matplotlib.use("Agg")

import numpy as np

from ps_eor import pspec
from ps_eor.ml_gpr.kernels import UVScaledKernel
from ps_eor.simu import SimuMultiGPCube


def make_figure(output):
    """Simulate three components and save their power-spectrum summary."""

    image_resolution = 0.000306  # radians
    n_pixels = 256
    freqs = np.arange(122, 134, 0.2) * 1e6
    umin, umax = 50, 250

    simulation = SimuMultiGPCube.new(
        image_resolution,
        n_pixels,
        freqs,
        umin,
        umax,
        uv_bins_du=20,
    )

    foreground_kernel = UVScaledKernel(
        family="rbf",
        variance=0.1,
        lengthscale=10,
        use_uv_ps=False,
    )
    signal_kernel = UVScaledKernel(
        family="exponential",
        variance=2e-4,
        lengthscale=0.7,
        use_uv_ps=False,
    )

    foreground = simulation.get_from_kern(foreground_kernel)
    signal = simulation.get_from_kern(signal_kernel)
    noise = simulation.get_noise(1e-3)

    ps_gen = pspec.PowerSpectraBuilder().get(
        signal,
        fmhz_range=(122, 134),
        umin=umin,
        umax=umax,
        du=8,
        window_fct="blackmanharris",
        ps2d_pos_only=False,
    )
    kbins = np.logspace(np.log10(ps_gen.kmin), np.log10(1), 9)

    panels = pspec.FourPanelPsResults(
        ps_gen,
        kbins,
        figsize=(10, 7),
    )
    panels.add_cube(foreground, "Smooth foreground")
    panels.add_cube(signal, "21-cm-like signal")
    panels.add_cube(noise, "White noise")
    panels.done()
    panels.savefig(output, dpi=160)


if __name__ == "__main__":
    output = (
        Path(__file__).resolve().parents[1]
        / "_static"
        / "power_spectra_four_panel.png"
    )
    output.parent.mkdir(parents=True, exist_ok=True)
    make_figure(output)
Auto, cross, and noise-debiased spectra#
An auto spectrum contains the noise bias of its input. If a matching noise
realization or expectation is available,
get_ps3d_with_noise subtracts its estimated power:
debiased = ps_gen.get_ps3d_with_noise(kbins, data_cube, noise_cube)
For statistically independent data splits, cross power avoids the mean uncorrelated-noise bias:
cross = ps_gen.get_cross_ps3d(kbins, split_a, split_b)
The two cubes must represent the same sky signal on compatible frequency and spatial grids. Cross power does not remove correlated systematics; a negative cross term can also cancel positive sky power in the total measured cross-spectrum. Inspect cylindrical auto, cross, and coherence products before interpreting a spherical average.
Weighting and excluded regions#
By default, estimators use cube weights when they are present. Wedge and
minimum-k_parallel selections act through the estimator weights during
spherical averaging; they do not erase the corresponding cells from the
cylindrical result. Keep these choices in the saved analysis configuration,
because changing them changes both the estimate and its effective number of
modes.